Lead: Ibrahim Chamseddine Faculty: Harald Paganetti, Maryam Moteabbed Postdoctoral fellows: Keyur Shah, Hoyeon Lee
Modeling radiation therapy in combination with tyrosine kinase inhibitors
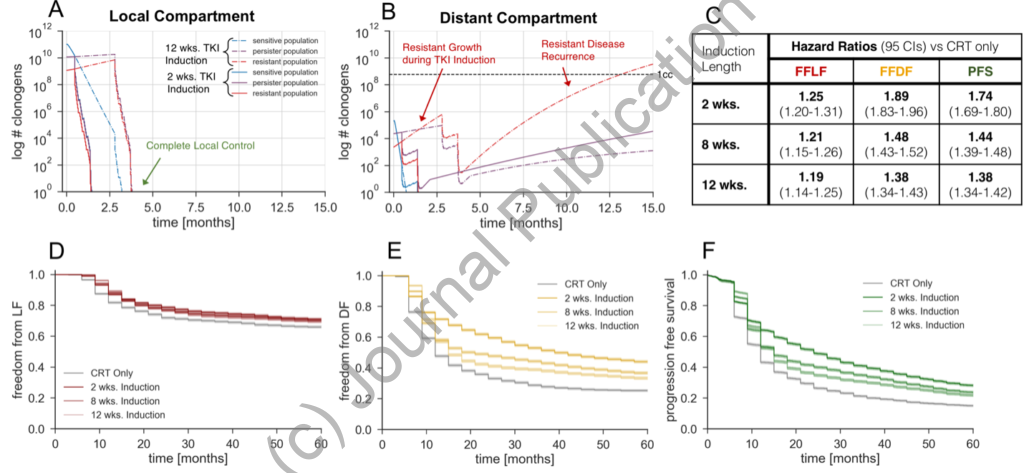
Model Predictions for Variable Induction Periods:Model predicted freedom from local failure (A), freedom from distant failure (B), and progression free survival (C) K-M curves for various induction lengths. The simulated treatment regimen is TKI induction, chemoradiotherapy, and adjuvant TKI maintenance. The local and distant tumor volume trajectory of the median simulated patient with an initial persistent fraction of 0.1 and initial resistant fraction of 0.01, stratified by TKI response cell subtypes, are shown in D and E respectively. Hazard ratios corresponding to the K-M curves (A, B, and C) are shown in F.
Modeling radiation therapy in combination with immune therapies
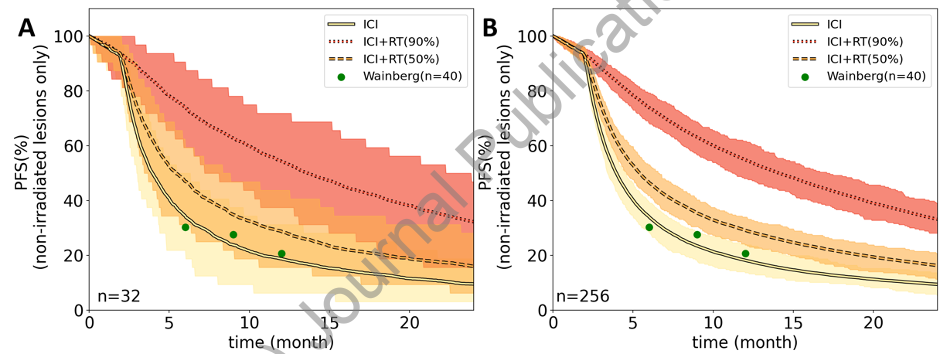
Simulated trial outcomes for ICI monotherapy, ICI-RT with 50% of visible disease irradiated, and ICI-RT with 90% of visible disease irradiated. RT was delivered with 8 Gy × 3, similar to NCT03482102. The observed 6, 9 and 12 months PFS in the clinical trial for ICI monotherapy are shown as green circles. Results are shown for (A) 32 patients per arm and (B) 256 patients per arm. The shaded areas signify the expected 95% confidence intervals. The sharp fall-off step after 3 months stems from the fact we assumed follow-up scans every 3 months and so no progression events are simulated before the first follow-up scan.
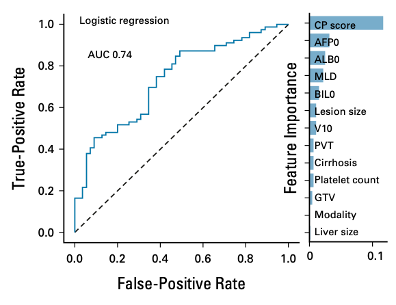
Personalized treatment for hepatocellular carcinoma using risk scores
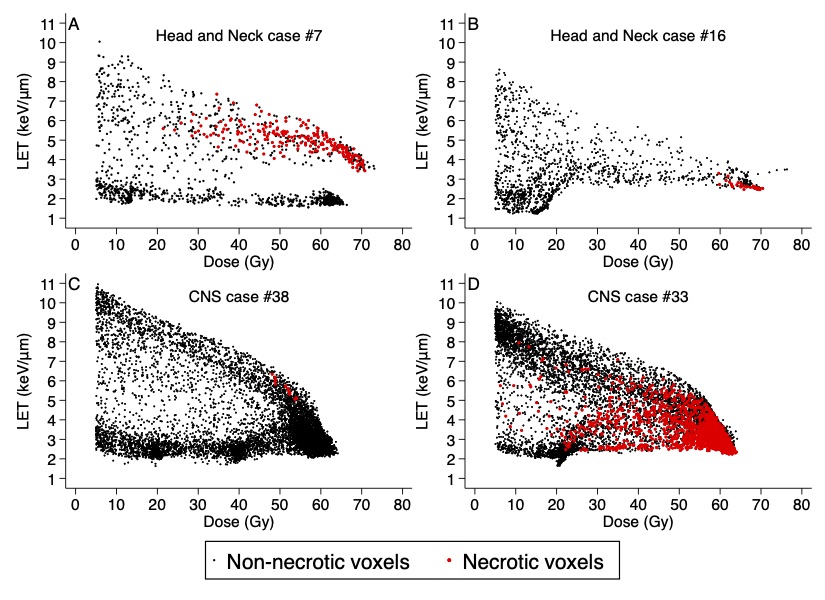
Brain necrosis in proton therapy patients
The potential differences in normal tissue toxicity between proton and photon irradiation can only be assessed by studies with a substantial amounts of clinical data due to the low frequencies of most toxicities in radiation therapy. In fact, when using clinical grading systems, such as CTCAE, variations in radiation therapy toxicity frequencies may in fact fall within the noise of patient specific radiosensitivity. In order to identify differential toxicities indicating variable biological effects, we propose to go beyond simple CTCAE grading and utilize novel approach to correlating toxicities quantified on one-dimensional (1D) blood biomarkers, two-dimensional (2D) dose-volume histogram (DVH) and normal tissue complication probability (NTCP) model biomarkers, and three-dimensional (3D) dose and imaging biomarkers.